How much bandwidth do you need is a question about peaks, not totals — and the arithmetic that answers it is short enough to do on the back of an envelope.
Port speeds are sold in gigabits per second. Workloads are not — they arrive as concurrent viewers, nightly backups or downloads per hour. Here is how to convert, and where the conversion usually goes wrong.
Start with the one conversion everything else uses
Network speeds are in bits, file sizes are in bytes, and the ratio is 8:
| Port |
Per second |
Per 30-day month at line rate |
| 1 Gbps |
125 MB/s |
~324 TB |
| 10 Gbps |
1.25 GB/s |
~3.2 PB |
| 25 Gbps |
3.1 GB/s |
~8.1 PB |
| 100 Gbps |
12.5 GB/s |
~32 PB |
| 200 Gbps |
25 GB/s |
~65 PB |
Those monthly figures assume the port is saturated every second of the month, which no real workload does. They are useful as a ceiling, not a forecast — and on an unmetered port they are not a bill either, because you pay for the pipe rather than the bytes. The number that decides your tier is the peak, not the total.
Live streaming: viewers × bitrate
One viewer consumes their rendition's bitrate for as long as they watch:
concurrent viewers × bitrate per viewer = required egress
At a typical 1080p ladder rung of 6 Mbps:
| Port |
Concurrent 1080p @ 6 Mbps |
Concurrent 4K @ 20 Mbps |
| 1 Gbps |
~166 |
~50 |
| 10 Gbps |
~1,660 |
~500 |
| 25 Gbps |
~4,160 |
~1,250 |
| 100 Gbps |
~16,600 |
~5,000 |
Three corrections people forget:
- ABR ladders do not multiply your egress — each viewer takes one rung at a time, not all of them. What multiplies is your ingest and transcode load.
- HTTP overhead is real but small. Add roughly 5% for segment requests, TLS and retransmits.
- Headroom is not optional. Size for your peak plus a margin, because a stream that saturates its port does not slow down gracefully; it buffers for everyone at once.
VOD and downloads: think in completion time
For file delivery the question is not "how many viewers" but "how fast does each transfer finish, and how many overlap":
concurrent transfers × per-transfer speed = required egress
A 10 Gbps port that serves 200 simultaneous downloads gives each one about 6 MB/s, if nothing else competes. If your users expect 25 MB/s each, that same port serves 50 of them at once. Decide which number you are promising before you pick a tier.
Backups and replication: work back from the window
This is the calculation that most often lands people on the wrong tier:
bytes ÷ seconds in the window × 8 = required bits per second
10 TB inside an 8-hour overnight window:
10 TB = 80,000,000,000,000 bits
8 hours = 28,800 s
80e12 ÷ 28,800 ≈ 2.8 Gbps
So a nominally quiet nightly job needs a sustained ~2.8 Gbps — on top of whatever the daytime workload uses, unless the window is genuinely idle. Replicating a 96 TB storage node is a different scale of problem: at 10 Gbps line rate the first full copy takes about 21 hours, and that is with nothing else on the wire.
Peak versus average
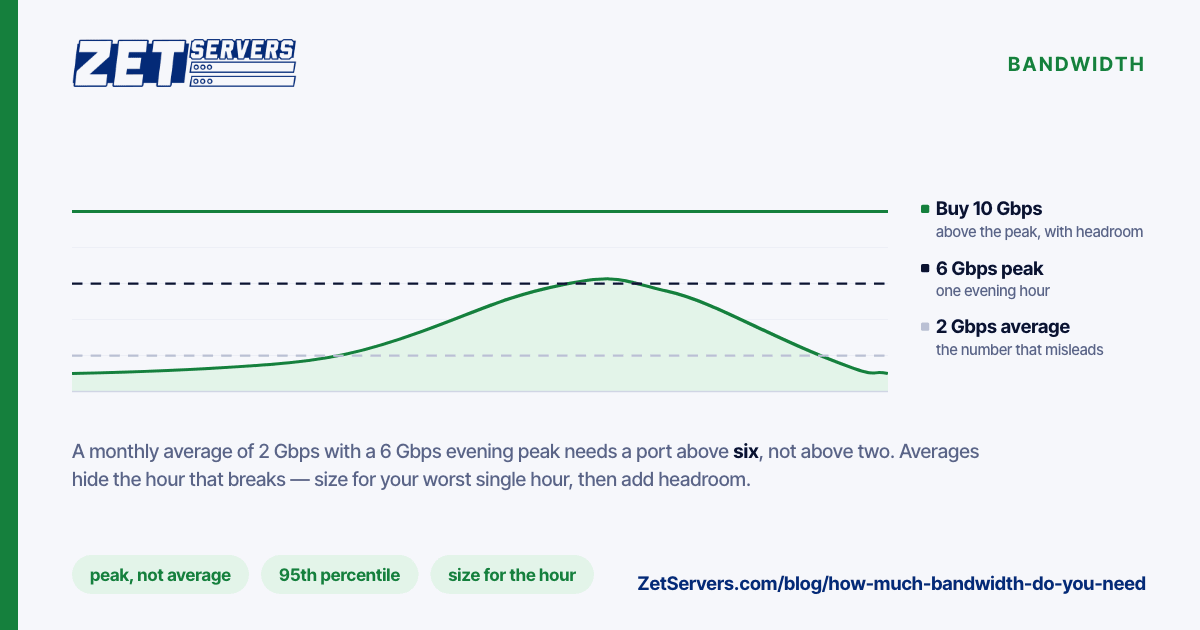
Averages hide the moment that breaks:
- A monthly average of 2 Gbps with a 6 Gbps evening peak needs a port above 6 Gbps, not above 2.
- Release days, live events and CDN cache-miss storms produce peaks several times the daily maximum. If your business has those, size for them — tell us the date and expected peak and we can provision headroom in advance.
- Traffic that arrives in one time zone concentrates into a few hours. A "global" audience that is 80% one country is not a global traffic curve.
Measure before you guess: graph 95th-percentile egress from your current host for a month, then compare it against your worst single hour.
Where the number is not egress at all
Sometimes the port is not the constraint:
- Disk. An HDD array streams sequential data at a few hundred MB/s. A 10 Gbps port asks for 1.25 GB/s. Without an NVMe tier for hot objects, the drives cap you long before the port does.
- CPU. TLS termination, transcoding and compression all consume cores. A saturated CPU produces the same symptom as a saturated port.
- The far end. Your users' own connections, and the peering path in between, decide what a single transfer achieves. Test the route from both ends with
mtr before blaming your own link.
Frequently asked questions
If the port is unmetered, why not take the biggest tier?
Because you pay for the pipe. An unmetered port removes the byte quota, not the price of capacity — the tier should match your peak, with headroom, not your ambition.
How do I measure what I am using now?
vnstat for daily and monthly totals, iftop or nload for a live view, and your current provider's 95th-percentile graph for the billing-grade number. To measure what a link can do rather than what it currently does, use iperf3 against a well-connected target — see how to verify your port speed.
Do speed test websites measure this correctly?
No. Most public speedtest endpoints cap out below 1 Gbps and will badly under-report a multi-gigabit link. Use iperf3 with several parallel streams instead.
Can I change tiers later?
Yes — dedicated servers step through 1, 2, 5, 10, 20, 25, 50, 100 and 200 Gbps, and VPS plans sit on a 25 Gbps port with 1 to 8 Gbps guaranteed depending on the plan. Start at the tier your measurements justify and move up when they change.
Next steps
Pick the tier from your peak, then confirm the line delivers it: how to verify your port speed covers the measurement and the kernel settings that quietly cap multi-gigabit transfers. The dedicated server tiers list what ships at each speed.